These functions provide ways of working with a region: a data frame with
numeric "left" and "right" columns, each row of which represents a unique
finite interval (open, either type of half-open, or closed). Values of "left"
and "right" columns should create an "ordered" set of intervals:
left[1] <= right[1] <= left[2] <= right[2] <= ... (intervals with zero
width are accepted). Originally, region_*() functions were designed to work
with output of summ_hdr() and summ_interval(), but can be used for any
data frame which satisfies the definition of a region.
region_is_in(region, x, left_closed = TRUE, right_closed = TRUE)

region_prob(region, f, left_closed = TRUE, right_closed = TRUE)

region_height(region, f, left_closed = TRUE, right_closed = TRUE)

region_width(region)

region_distance(region, region2, method = "Jaccard")

region_draw(region, col = "blue", alpha = 0.2)
Arguments
| region | A data frame representing region. |
|---|---|
| x | Numeric vector to be tested for being inside region. |
| left_closed | A single logical value representing whether to treat left ends of intervals as their parts. |
| right_closed | A single logical value representing whether to treat right ends of intervals as their parts. |
| f | A pdqr-function. |
| region2 | A data frame representing region. |
| method | Method for computing distance between regions in
|
| col | Single color of rectangles to be used. Should be appropriate for
|
| alpha | Single number representing factor modifying the opacity alpha; typically in [0; 1]. |
Value
region_is_in() returns a logical vector (with length equal to
length of x) representing whether certain element of x is inside a
region.
region_prob() returns a single number between 0 and 1 representing total
probability of region.
region_height() returns a single number representing a height of a region
with respect to f, i.e. minimum value that corresponding d-function can
return based on relevant points inside a region.
region_width() returns a single number representing total width of a
region.
region_draw() draws colored rectangles filling region intervals.
Details
region_is_in() tests each value of x for being inside interval.
In other words, if there is a row for which element of x is between "left"
and "right" value (respecting left_closed and right_closed options),
output for that element will be TRUE. Note that for zero-width
intervals one of left_closed or right_closed being TRUE is enough to
accept that point as "in region".
region_prob() computes total probability of region according to
pdqr-function f. If f has "discrete" type, output is
computed as sum of probabilities for all "x" values from "x_tbl" metadata which lie inside a region (respecting left_closed
and right_closed options while using region_is_in()). If f has
"continuous" type, output is computed as integral of density over a region
(*_closed options having any effect).
region_height() computes "height" of a region (with respect to f):
minimum value of corresponding to f d-function can return based on relevant
points inside a region. If f has "discrete" type, those relevant points are
computed as "x" values from "x_tbl" metadata which lie inside a region (if
there are no such points, output is 0). If f has "continuous" type, the
whole intervals are used as relevant points. The notion of "height" comes
from summ_hdr() function: if region is summ_hdr(f, level) for some
level, then region_height(region, f) is what is called in summ_hdr()'s
docs as "target height" of HDR. That is, a maximum value of d-function for
which a set consisting from points at which d-function has values not less
than target height and total probability of the set being not less than
level.
region_width() computes total width of a region, i.e. sum of differences
between "right" and "left" columns.
region_distance() computes distance between a pair of regions. As in
summ_distance(), it is a single non-negative number representing how much
two regions differ from one another (bigger values indicate bigger
difference). Argument method represents method of computing distance.
Method "Jaccard" computes Jaccard distance: one minus ratio of intersection
width and union width. Other methods come from summ_distance() and
represent distance between regions as probability distributions:
If total width of region is zero (i.e. it consists only from points), distribution is a uniform discrete one based on points from region.
If total width is positive, then distribution is a uniform continuous one based on intervals with positive width.
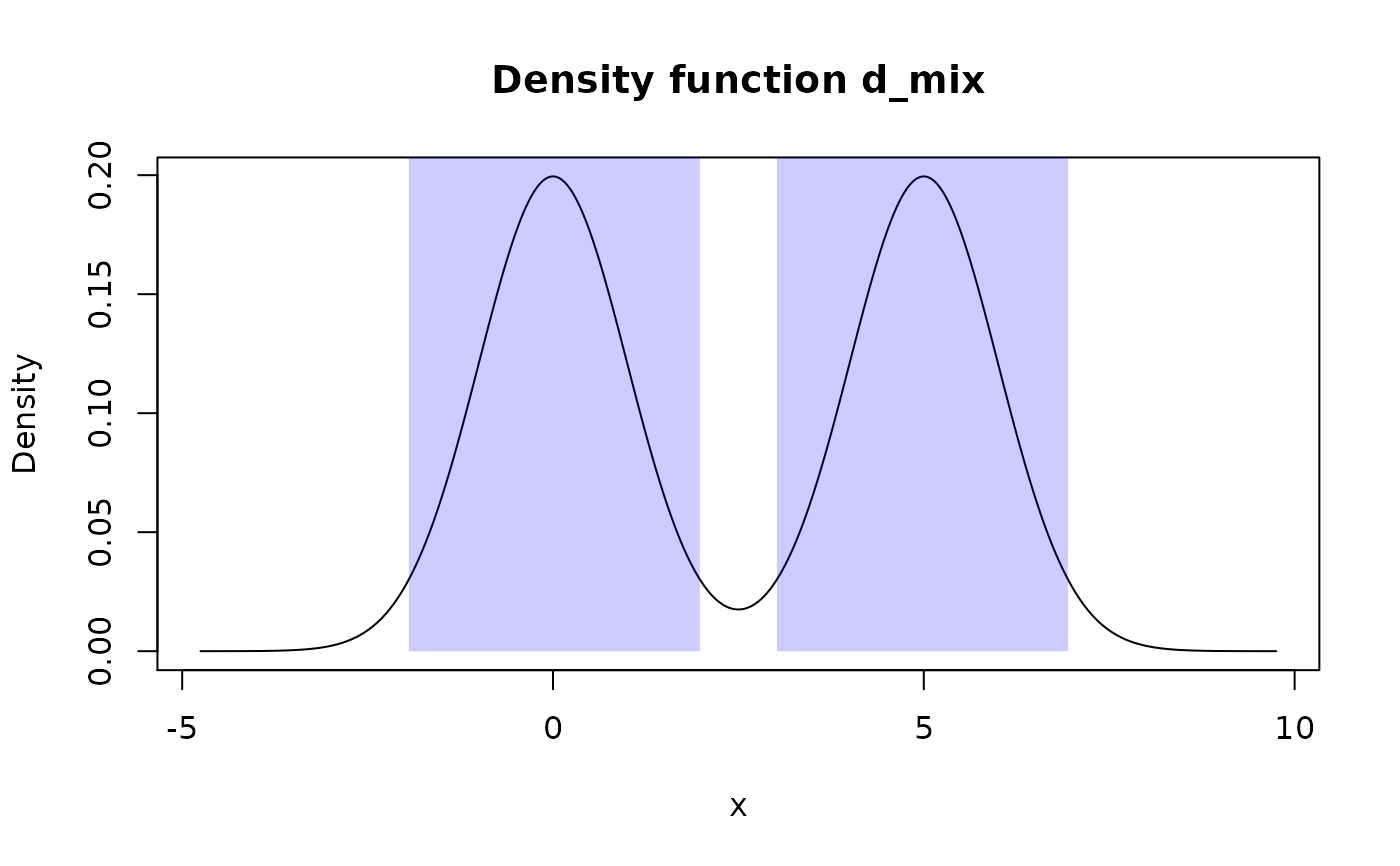
region_draw() draws (on current plot) intervals stored in region as
colored rectangles vertically starting from zero and ending in the top of the
plot (technically, at "y" value of 2e8).
See also
summ_hdr() for computing of Highest Density Region.
summ_interval() for computing of single interval summary of distribution.
Examples
# Type "discrete"
d_binom <- as_d(dbinom, size = 10, prob = 0.7)
hdr_dis <- summ_hdr(d_binom, level = 0.6)
region_is_in(hdr_dis, 0:10)
#> [1] FALSE FALSE FALSE FALSE FALSE FALSE TRUE TRUE TRUE FALSE FALSE## This should be not less than 0.6
region_prob(hdr_dis, d_binom)
#> [1] 0.7004233region_height(hdr_dis, d_binom)
#> [1] 0.2001209region_width(hdr_dis)
#> [1] 2
# Type "continuous"
d_norm <- as_d(dnorm)
hdr_con <- summ_hdr(d_norm, level = 0.95)
region_is_in(hdr_con, c(-Inf, -2, 0, 2, Inf))
#> [1] FALSE FALSE TRUE FALSE FALSE## This should be approximately equal to 0.95
region_prob(hdr_con, d_norm)
#> [1] 0.9500426## This should be equal to `d_norm(hdr_con[["left"]][1])`
region_height(hdr_con, d_norm)
#> [1] 0.05840531region_width(hdr_con)
#> [1] 3.920624
# Usage of `*_closed` options
region <- data.frame(left = 1, right = 3)
## Closed intervals
region_is_in(region, 1:3)
#> [1] TRUE TRUE TRUE## Open from left, closed from right
region_is_in(region, 1:3, left_closed = FALSE)
#> [1] FALSE TRUE TRUE## Closed from left, open from right
region_is_in(region, 1:3, right_closed = FALSE)
#> [1] TRUE TRUE FALSE## Open intervals
region_is_in(region, 1:3, left_closed = FALSE, right_closed = FALSE)
#> [1] FALSE TRUE FALSE
# Handling of intervals with zero width
region <- data.frame(left = 1, right = 1)
## If at least one of `*_closed` options is `TRUE`, 1 will be considered as
## "in a region"
region_is_in(region, 1)
#> [1] TRUEregion_is_in(region, 1, left_closed = FALSE)
#> [1] TRUEregion_is_in(region, 1, right_closed = FALSE)
#> [1] TRUE## Only this will return `FALSE`
region_is_in(region, 1, left_closed = FALSE, right_closed = FALSE)
#> [1] FALSE
# Distance between regions
region1 <- data.frame(left = c(0, 2), right = c(1, 2))
region2 <- data.frame(left = 0.5, right = 1.5)
region_distance(region1, region2, method = "Jaccard")
#> [1] 0.6666667region_distance(region1, region2, method = "KS")
#> [1] 0.5